

At SPSS, we normally work from 3 windows. These are
- the data editor window SPSS data editor window icon;
- the syntax editor window SPSS syntax editor window icon;
- the results viewer window SPSS results in viewer window icon.
The main window of SPSS is the data editor. This is the only window that is always open when we run SPSS. Although it is called a “data editor”, we use it only to inspect our data. We highly recommend
never edit data in the data editor.
The correct way to edit data, and also faster, is by using syntax, which we will discuss in the next tutorial.
Okay, now let’s download and open the bank. sav. We will use it to guide you through the main parts of the data editor.
SPSS Data View and Variables View
An SPSS data file always has two tabs in the lower-left corner:
- The data view is where we inspect our actual data and
- The Variable View is where we see additional information about our data.

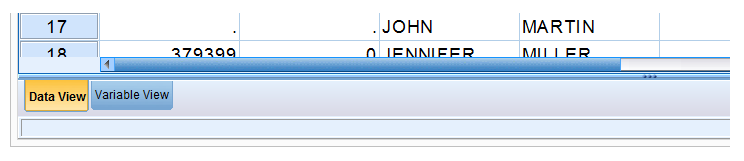
You can switch between data view and variables view
- by clicking on the tabs in the lower-left corner;
- using the hotkey Ctrl + t;
- double-clicking on the name of a variable in the Data View;
- by double-clicking a schematic number in Variable View.
Let’s first take a close look at the main parts of the Data View tab. Then we will proceed with the variables view.
SPSS data view


- The data editor has tabs for switching between Data View and Variable View. For now, make sure you are in Data View.
- The columns of cells are called variables. Each variable has a unique name (“gender”) that is displayed in the column header.
- The rows of cells are called cases. Often each respondent in a study is represented as a single case.
- In SPSS, the values refer to the content of the cell.
- The status bar can provide useful information about the data, for example, whether a WEIGHT, FILTER, SPLIT FILE, or Unicode mode is in effect.
These are the main elements of the Data View. Let’s now switch to the variable view.
SPSS Variables View

- In the lower-left corner, we find tabs to switch between Variable View and Data View. For now, select Variable view.
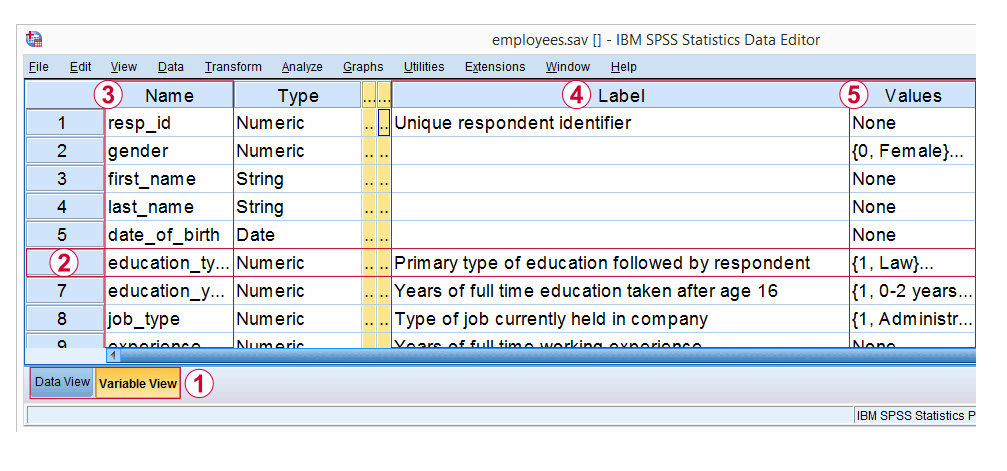
- In Variable View, variables are displayed as rows of cells.
- The first column shows the variable name for each variable.
- The fifth column may or may not contain a variable label. This describes the exact meaning of each variable.
- The sixth column shows value labels: descriptions of the meaning of one, many, or all of the values that a variable can contain.
In short, Variable View does not display the data itself, but rather information about the data. This is sometimes called “metadata” or “the codebook.” In SPSS, however, it is called a dictionary.
This is important to know because you can find commands like DISPLAY DICTIONARY or APPLY DICTIONARY in manuals. If you are familiar with the syntax, running
DISPLAY DICTIONARY.
creates the output shown below: dictionary information as seen in the variables view.

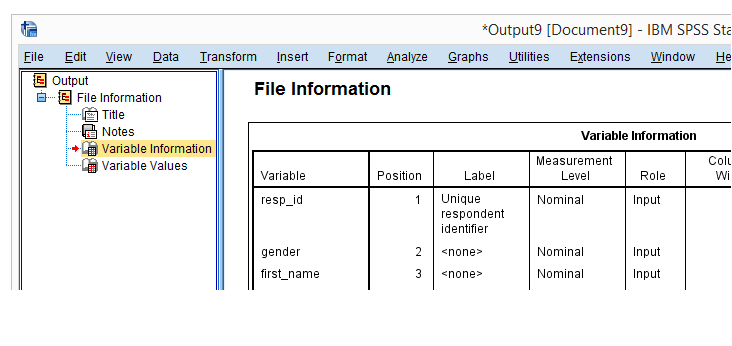
Dictionary information reported when executing DISPLAY DICTIONARY.
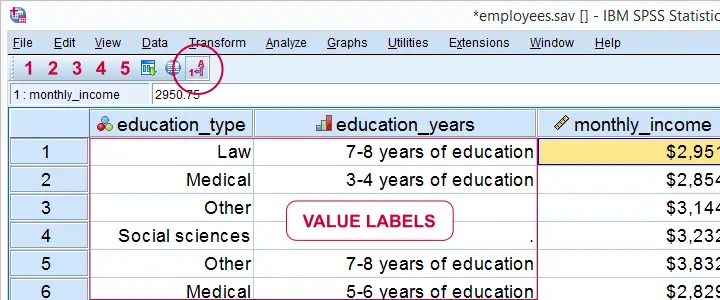
Variable View – Value Labels
For some variables, it is immediately clear what their values mean: a value of € 2,500, – in a variable “gross monthly income” represents a gross monthly income of € 2,500, -.
However, this is not always the case: response categories for categorical variables are often represented by numbers, usually 1 through x. What these values represent is stored in their value labels. Clicking the open value labels icon for education type displays all value labels for this variable.


Value labels for education_type.
These value labels tell us that a person with a value of 1 in the education_type indicates someone who studied “Law.” Similarly, “Economy” is represented by a value of 2, and so on.
So far, we explained that the SPSS data editor always has 2 tabs:
Dictionary Information in Data View
So far, we explained that the SPSS data editor always has 2 tabs:
- Data view in which we inspect our actual data values and
- Variable view in which we find information about our data – dictionary information.
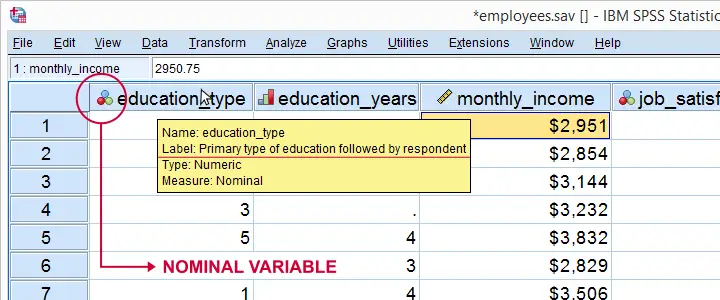
- What many SPSS users don’t know is that we can also see dictionary information in Data View. Let’s start with the value labels. Initially, we only see data values in the Data View as shown below.

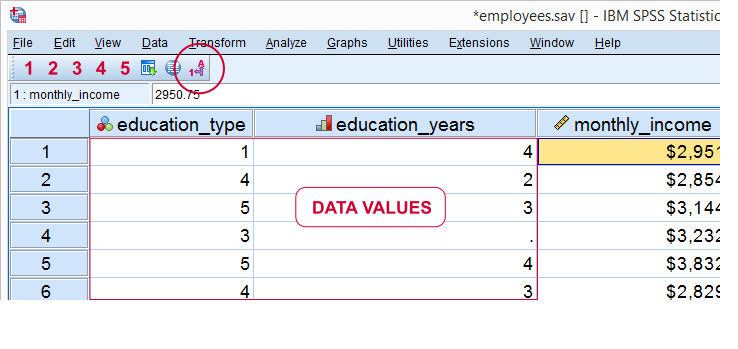


So this allows you to look up what your data means without having to switch between Data View and Variable View. Perhaps even more useful: place the mouse pointer on the name of a variable in Data View without clicking on it. Now a yellow box with a lot of information from the dictionary appears for a few seconds.
Variable view: value labels
Starting with SPSS version 22, the icons next to the variable names tell us something about our variable types, formats and measurement levels, that is, if they are configured correctly.
Final notes
So basically the “data” consists of 2 elements:
the data values we see in the Data View and
Dictionary information about our data in the variables view.
We can save the content of the data editor as an SPSS data file or as a .sav file. If we do, the resulting file still contains everything in both the data view and the variable view.
Again, let’s emphasize that you should never, under any circumstances, change anything manually in Data View or Variable View. This is possibly the worst SPSS practice. And yes, I know. Many SPSS users do this anyway. But most, sooner or later, will wish they hadn’t.
The only efficient way to change the data or information in the dictionary is through syntax. Let’s move on to our next tutorial: Introduction to SPSS Syntax.
Thank you for reading.